
Short answer: compare like periods, then adjust for prices
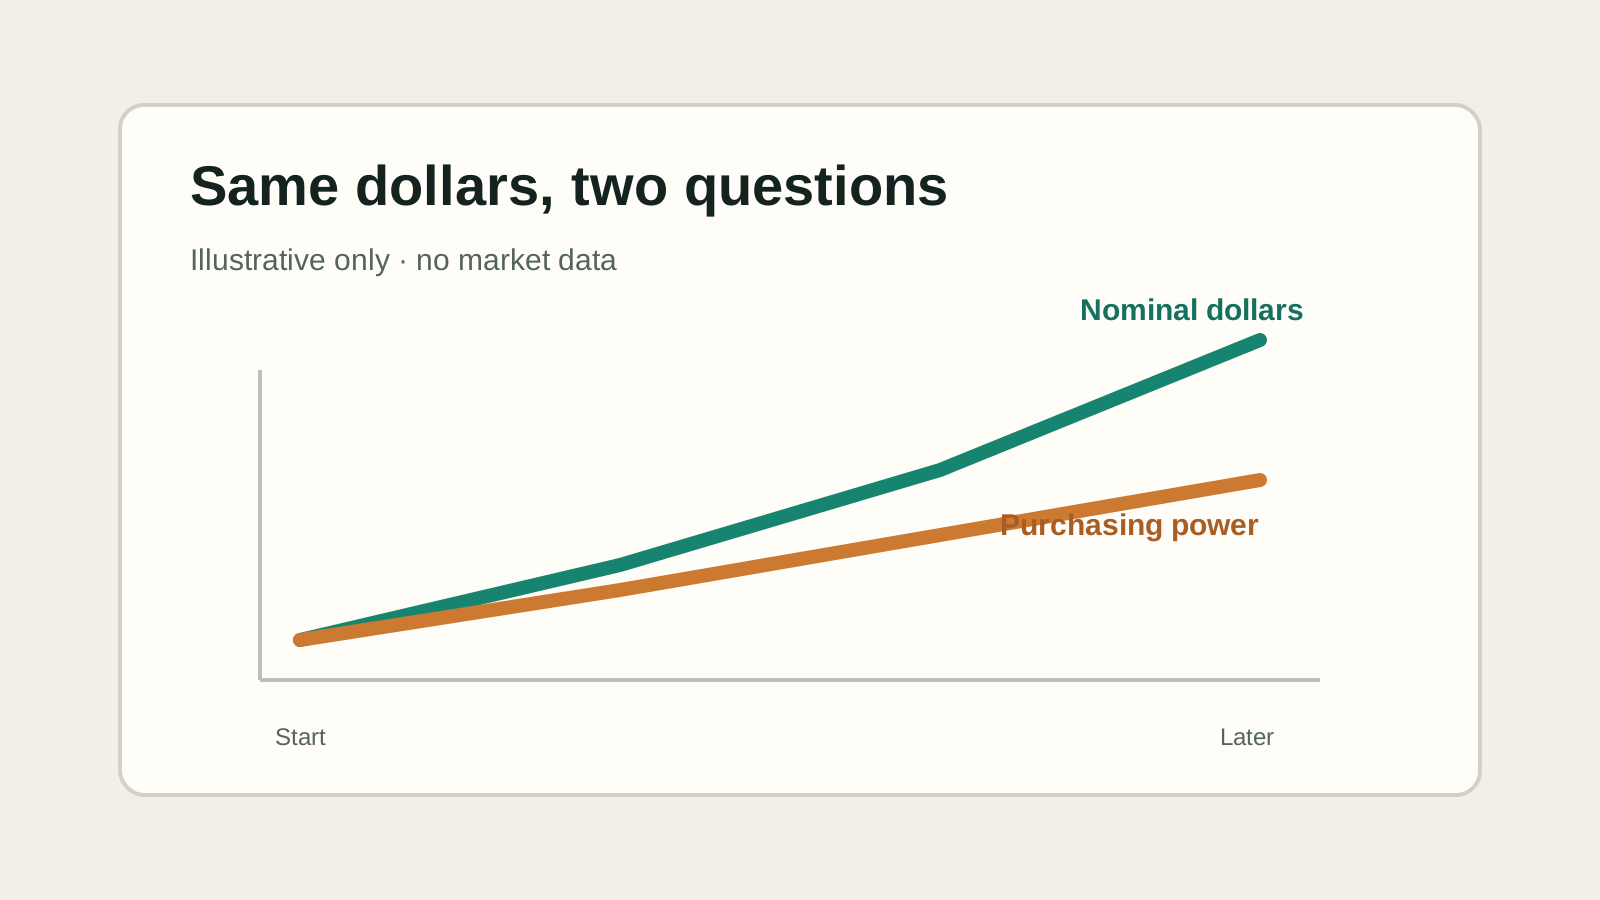
A nominal return is the percentage change in the stated money amount before adjusting for inflation. A compound return accounts for growth on prior growth over multiple periods. A real return adjusts the nominal result for inflation, so it describes change in purchasing power; the Investor.gov glossary also defines real return after taxes. This lesson’s example is pretax because no tax situation is assumed.
Inflation is not one person’s personal spending rate. The U.S. Bureau of Labor Statistics describes CPI as a measure of average price change for a representative basket consumed by a defined population. Your basket and experience can differ. The CPI is not a measure of investment performance.
Inflation, disinflation and deflation describe different price paths
Distinguish the direction of prices from the rate of change
Inflation is a sustained increase in the general price level. Disinflation means the inflation rate is falling while the overall price level is still rising more slowly. Deflation is a sustained decrease in the general price level. A cheaper price for one product alone does not establish economy-wide deflation; the terms refer to broad price measures over time. Definitions are general and do not predict what any household or asset will experience.
Fictional index check: a basket index rises from 100 to 110, then from 110 to 112.2. Prices rose 10% in the first period and 2% in the second: inflation continued, but slowed, so the second period illustrates disinflation. If the next index instead falls from 112.2 to 110 and the decrease is sustained across a broad measure, that is deflation; one item falling would not be enough. The numbers are invented solely to distinguish the concepts.
For purchasing-power calculations, match the index population and dates to the return period. A published index such as CPI summarizes its defined basket and population, not every person's costs.
Use compound growth and a matching inflation period
Nominal return versus real return
For a single amount with a constant nominal annual rate and annual compounding, use final value = starting value × (1 + nominal rate)years. For one matched period, the exact real return is (1 + nominal return) ÷ (1 + inflation rate) − 1. Subtracting the inflation rate from the nominal rate is a convenient rough approximation for small rates, but it is not the exact calculation.
Across multiple matched periods, compare growth factors: real growth factor = nominal growth factor ÷ price-index growth factor. If both annual rates stay constant for two years, that is (1 + nominal rate)2 ÷ (1 + inflation rate)2. With actual data, use the start and end CPI index values for the same dates and population series, rather than mixing monthly inflation with an annual return.
Solved fictional example: $1,000 over two years
All rates and dollar values below are hypothetical teaching inputs, not historical U.S. inflation or a forecast. Assume $1,000 earns a constant 5% nominal return each year, compounded annually, for two years. Assume a hypothetical consumer-price index rises 3% in each of those same years. There are no deposits, withdrawals, taxes or fees.
| End of period | Nominal value | Hypothetical price index | Purchasing power in year-0 dollars |
|---|---|---|---|
| Start | $1,000.00 | 100.00 | $1,000.00 |
| Year 1 | $1,050.00 | 103.00 | $1,019.42 |
| Year 2 | $1,102.50 | 106.09 | $1,039.21 |
- Nominal value:
$1,000 × 1.05 × 1.05 = $1,102.50, a cumulative nominal return of1.05² − 1 = 10.25%. - Price level:
100 × 1.03 × 1.03 = 106.09, or a 6.09% cumulative rise in this hypothetical basket. - Real cumulative return:
(1.05² ÷ 1.03²) − 1 = 3.9212%. The ending amount buys what about$1,102.50 ÷ 1.0609 = $1,039.21bought at the start. - Annualized real return:
(1 + 3.9212%)1/2 − 1 ≈ 1.9417% a year. This is not the same as the two-year cumulative rate.
For comparison, the quick subtraction estimate is 5% − 3% = 2% per year. The exact one-year real rate is 1.05 ÷ 1.03 − 1 ≈ 1.9417%. The approximation is close here, but the exact ratio is the correct matched-period calculation.
Historical U.S. CPI illustration: use the index levels and matching dates
Historical statistical example, not investment performance: an archived U.S. Bureau of Labor Statistics release reports CPI-U, U.S. city average, all items, not seasonally adjusted (1982-84=100), at 314.175 for June 2024 and 322.561 for June 2025. These index levels describe the BLS series and its defined population/basket; they are not any individual's cost of living or an asset return. The release reports the year-over-year change rounded to 2.7%.
Using the unrounded index levels, the one-year price factor is 322.561 / 314.175 = 1.026692..., a change of about 2.6692%. If a separate, entirely hypothetical amount earned 5% nominal over those same June-to-June dates, its exact real return would be 1.05 / (322.561 / 314.175) - 1 ≈ 2.2702%. A hypothetical $1,050 ending balance would represent about $1,050 x 314.175 / 322.561 = $1,022.70 in June 2024 basket dollars. The 5% return and $1,050 are invented for arithmetic; the CPI observations are historical. This comparison is not a forecast, a return claim, or an investment recommendation.
Rate, time and contributions change nominal totals
Compound growth and regular contributions
With the same $1,000 start and annual compounding, the hypothetical nominal ending values below show how rate and time affect the math. They are not expected or promised returns.
| Annual rate | 1 year | 2 years | 3 years |
|---|---|---|---|
| 3% | $1,030.00 | $1,060.90 | $1,092.73 |
| 5% | $1,050.00 | $1,102.50 | $1,157.63 |
| 7% | $1,070.00 | $1,144.90 | $1,225.04 |
Contributions also change the ending balance. For a separate nominal example, keep the same $1,000 starting balance invested for 24 months at a hypothetical 5% nominal annual rate compounded monthly, with the monthly rate set to 0.05 ÷ 12. Add $100 at the end of each month (an ordinary annuity). The starting balance grows to $1,000 × (1 + 0.05 ÷ 12)24 = $1,104.94; the 24 contributions grow to $100 × (((1 + 0.05 ÷ 12)24 − 1) ÷ (0.05 ÷ 12)) = $2,518.59. Together, the modeled ending nominal balance is $3,623.53, including $2,400 contributed. This is arithmetic under fixed hypothetical assumptions, before fees, taxes and inflation; it is not a return forecast or a 5% return on the full ending balance.
Simple interest versus annual compounding
Fictional two-year comparison: start with $1,000 and use a hypothetical 5% rate each year, with no deposits, withdrawals, taxes or fees. Under simple interest, interest stays based on the original $1,000: $1,000 + ($1,000 × 0.05 × 2) = $1,100. Under annual compounding, year-one interest is added to the base: $1,000 × 1.05 × 1.05 = $1,102.50. In year two, the simple example earns $50 on the original principal; the compound example earns $52.50 on the $1,050 year-one balance. The $2.50 difference is interest on prior interest, not an extra promised return. The rate and outcomes are invented arithmetic, not a forecast or offer.
What this calculation does not tell you
- It does not predict future inflation, asset prices, fees, taxes or returns.
- A CPI series summarizes average price changes for its defined population and basket; it is not your personal cost-of-living measure.
- Nominal account growth can still mean reduced purchasing power if the matched price level grows faster.
- Real-return arithmetic does not measure risk, liquidity, tax treatment, or whether an asset is suitable for anyone.
- Do not compare periods with mismatched start/end dates, annualized versus cumulative rates, or different compounding conventions.
The example is arithmetic education, not personalized investment, tax or inflation advice. The source pages support definitions and calculation concepts; they do not verify any asset’s performance.