
One release is evidence, not a diagnosis
GDP, employment and price statistics describe different parts of economic activity. A surprising number does not by itself prove that the whole economy entered a new phase, identify a cause, or tell you what an asset will do.
This U.S.-focused method uses BEA and BLS examples to interpret data, not to apply a formal business-cycle dating method. It is not a live macro report. Sources reviewed 26 October 2026; no current values are reproduced.
A cycle is broader than one statistic
Economic activity can strengthen or weaken across multiple dimensions over time. A broad cycle assessment is different from labeling one statistic. One negative GDP quarter or weak survey by itself does not establish a broad contraction; definitions and formal dating methods vary by jurisdiction and institution.
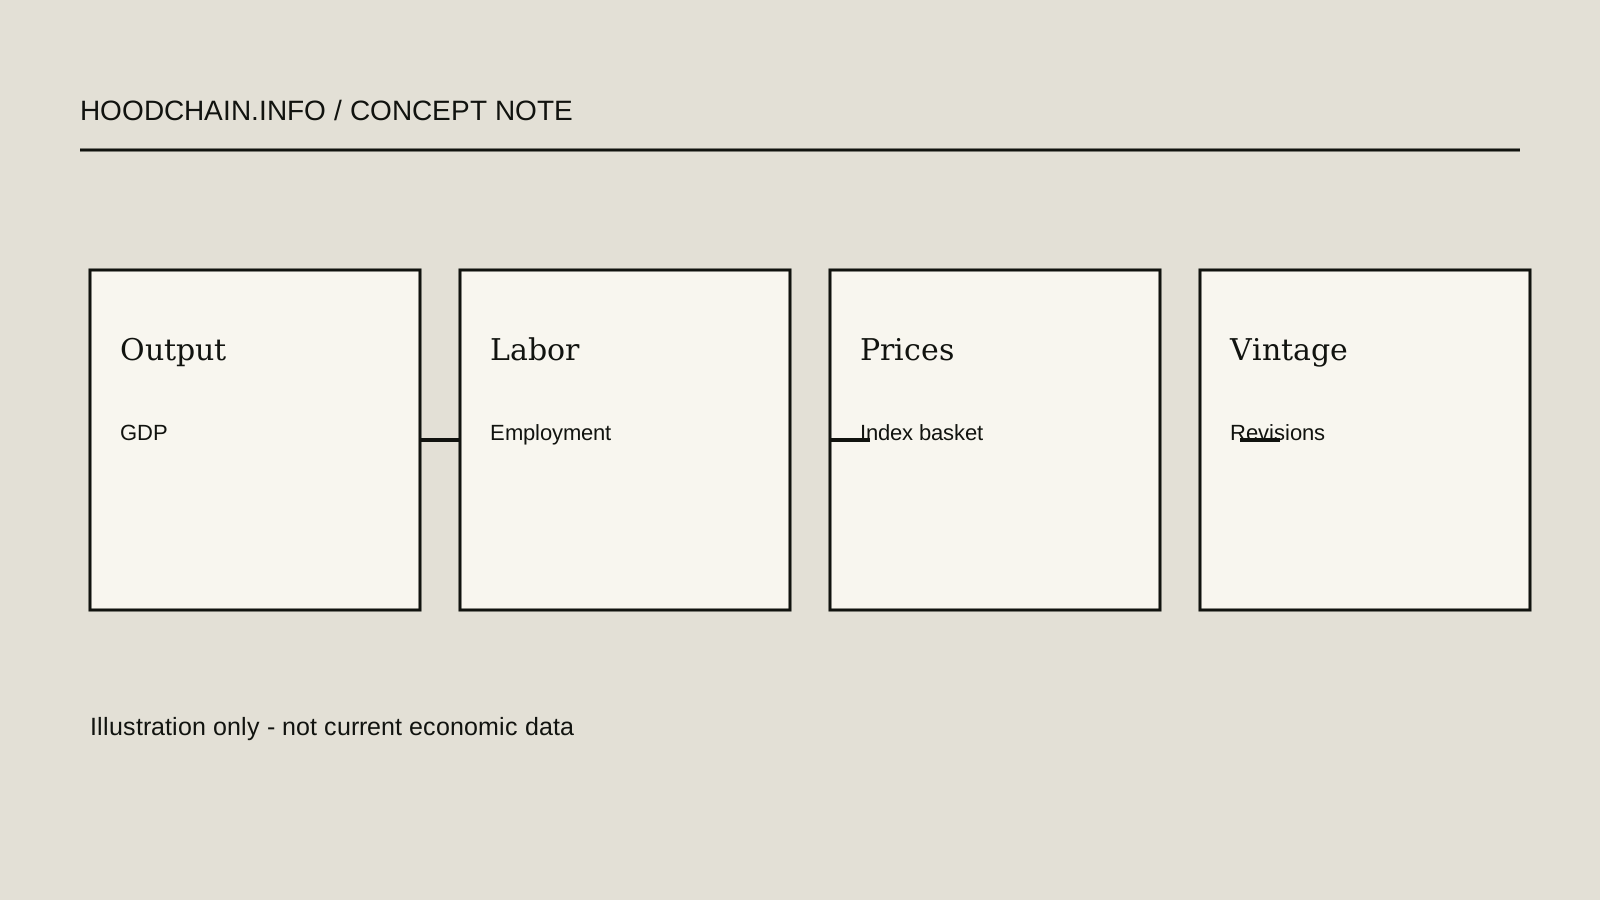
Indicators measure distinct dimensions. BEA real GDP measures inflation-adjusted value of final goods and services produced in the United States. BLS's Employment Situation reports monthly labor statistics from household and establishment surveys. A consumer-price index measures prices for its defined population and basket. None alone captures all production, jobs, prices or household experience.
Match each indicator to what it measures
| Series | What the source measures | One observation does not show |
|---|---|---|
| BEA real GDP | Inflation-adjusted final production in the United States | Every household's welfare, distribution or a future market return |
| BLS Employment Situation | Monthly labor measures from separate household and establishment surveys | Every worker, employer or form of economic stress |
| BLS price index | Price movement for a defined statistical population and basket | Each person's exact cost of living or the cause of each price change |
Record the reference period and estimate vintage
Some series are estimates based on sample or incomplete source data. BEA publishes successive GDP estimates and provides comparisons between vintages. BLS documents methods and revisions for labor series. A later estimate can differ as additional source or benchmark data arrive; revision alone does not prove misconduct or make an earlier release useless.
For a reproducible note, record the agency and series, release date, reference period, adjustment basis, estimate vintage, and exact table/line. Do not compare a monthly rate with an annualized quarterly rate as if the periods matched.
Fictional exercise E-74: separate observation from inference
Invented teaching card: an output index's first estimate rises 0.4% in a quarter; a later vintage revises it to 0.1%. A monthly hiring measure shows fewer additions than the prior month. These are fictional values, not current U.S. statistics.
Answer: the revised output estimate remains positive but is smaller, and the hiring measure slowed. The series describe different dimensions and periods. One cannot infer that either caused the other, that a recession is confirmed, or that an asset price must move a certain way. Check definitions, seasonal adjustment, source data and later vintages.
A short checklist for reading a release
- Identify the agency and technical definition.
- Separate release date from reference period.
- Read comparison basis and vintage; inspect revisions.
- Compare like units, frequency and adjustment.
- Write “the data show” separately from “one possible explanation is.”
- Use multiple measures and context; do not turn one release into a trading signal.
Read the label before interpreting a release
A release label tells you what a number means and what it does not. Record the publisher, series/table, reference period, release date and vintage; then capture frequency, units, seasonal-adjustment basis and comparison period. A monthly seasonally adjusted change is not interchangeable with a quarterly annualized rate or a year-over-year change.
For U.S. examples, BEA's GDP release separates release date from the quarter measured and publishes successive estimates. BLS describes the Employment Situation's distinct household and establishment surveys; its CPI FAQ defines the index population, reference base and seasonal-adjustment choices. Sources reviewed 26 October 2026; no live release values are copied here.
Fictional release card R-84
| Publisher / series | Example Statistics Office / Household Output Index |
|---|---|
| Release date | 18 November 20X6 |
| Reference period | October 20X6 |
| Frequency / unit | Monthly; index points, base period 20X0=100 |
| Adjustment | Seasonally adjusted |
| Comparison | Index 102.4 in October vs 102.1 in September; +0.3 index points, about +0.29% month over month |
| Estimate vintage | First estimate; next release may revise it |
Worked answer: compare like monthly index points: 102.4−102.1=0.3 points. Relative change is 0.3÷102.1×100≈0.29% for one month. Because this invented observation is seasonally adjusted, do not describe it as an unadjusted raw change. It says nothing by itself about year-over-year change, a broader cycle, cause, a household's personal costs or an asset return.
Checklist for a real release
- Check the agency and exact series/table; beware copied chart snippets without metadata.
- Separate release date from reference period.
- Read frequency and unit (index points, percent, level, annualized rate).
- Record seasonal adjustment and comparison basis.
- Identify the vintage and whether revisions are scheduled.
- Explain only what the measure supports; compare with other evidence before drawing a broader conclusion.
Sources: BEA Gross Domestic Product and BEA GDP Revision Information (U.S. GDP release, historical comparison and estimate vintage); BLS Employment Situation Quick Guide (U.S. household/establishment survey methods); and BLS CPI FAQs (U.S. CPI population, index base and seasonal adjustment). Reviewed 26 October 2026. The R-84 card is entirely fictional, not agency data.